
Hands-on Power BI
Open almost any analyst job listing in Pakistan and Power BI is in it. Finance officers, operations staff, HR teams, all being asked for it. Over eight weekends on our Islamabad campus we take you from opening Power BI…
Course description
Open almost any analyst job listing in Pakistan and Power BI is in it. Finance officers, operations staff, HR teams, all being asked for it. Over eight weekends on our Islamabad campus we take you from opening Power BI Desktop for the first time to publishing a secured, interactive dashboard a manager can read on their phone at a traffic light. Every lab runs on data that looks like what you'll meet at work, a Lahore distributor's sales, a Karachi bank's branch performance, telecom recharge data, a Rawalpindi school's exam results.
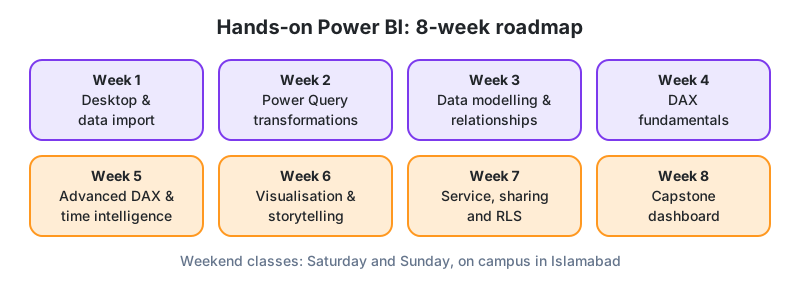
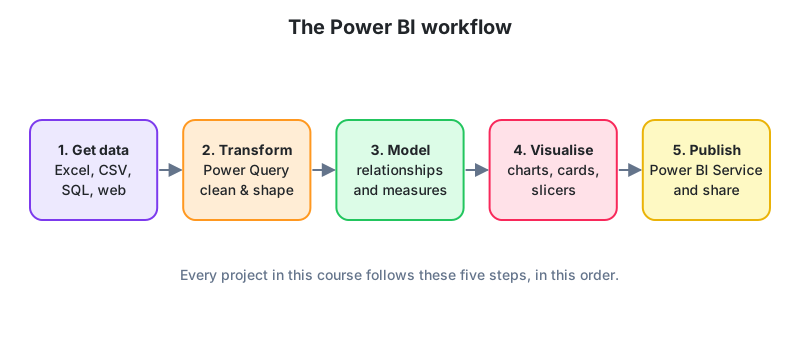
We teach the workflow in the order professionals use it, not the order the menus appear in. Import and clean with Power Query. Build a proper star schema. Write DAX measures that answer real questions, including "how does this compare with last year?" and running totals, which is where most self-taught users get stuck. Then design reports that make one point clearly. The last two weekends cover Power BI Service, scheduled refresh, row-level security and a graded capstone you can bring to interviews.
Each week has a lab you finish in class with a mentor beside you, plus a small deliverable you complete at home. If you're comfortable in Excel you're ready. We've had accountants, teachers and fresh graduates in the same room and it works.
What You'll Learn
Skills You'll Gain
Test Yourself
Import and profile a messy sales workbook
Load a multi-sheet Excel file from a Lahore FMCG distributor, profile every column for blanks, duplicates and wrong types, and write the problems down before you touch a single one. Fixing first and documenting later is how mistakes get buried.
Hands-on Lab Task
Reshape monthly columns into a tidy table
Unpivot twelve month columns into rows, merge product details from a second sheet and append three years of files into one query. Then drop in a fourth file and watch it refresh without you.
Hands-on Lab Task
Build a star schema with a date table
Split a flat export into FactSales and four dimensions, build a DAX date table, set one-to-many relationships and check the filter direction with a slicer before you trust a single total.
Hands-on Lab Task
Write ten core DAX measures
Write measures for total sales, cost, margin %, average order value, distinct customers and a top-N product rank, then test each against an Excel pivot. Two of them will disagree the first time. Find out why.
Hands-on Lab Task
Add time-intelligence comparisons
Add YTD, previous year, YoY growth % and a three-month rolling average to a Karachi bank's monthly branch deposits, and validate two months by hand.
Hands-on Lab Task
Publish a secured report
Publish to Power BI Service, set a scheduled refresh, create a regional RLS role, test it with 'View as' and share it through an app.
Hands-on Lab Task
Curriculum
Before you learn a single formula you need the shape of the tool and the whole journey from raw file to published page. Otherwise week four feels like magic and week seven feels like a different product. So Saturday is the map, Sunday is your first report.
What we cover
- What Power BI is, how it differs from Excel and Google's Looker Studio, and where it sits in a company
- Installing Power BI Desktop and a tour of the Report, Data and Model views
- Connecting to Excel, CSV, folders, SQL Server and PostgreSQL, with a first look at import versus DirectQuery
- Data types, column quality and a first walk through the Power Query editor
- Your first three visuals and a slicer, built from a retail sales file
In the lab
Import a Lahore distributor's workbook (three sheets, twelve months), profile every column for blanks and errors, and build a one-page report with total sales, sales by city and a month slicer. Expect to find at least one column of numbers stored as text. Everyone does.
Bring back next week
A .pbix file with the imported data and the one-page report, plus a short list of the data quality problems you found.
Faisal Adnan
Lead Trainer, Code School of Analytics
Power BI, Data Warehousing & AI-assisted developmentFaisal leads CSA's Power BI, Data Warehouse and Vibe Coding programs, bringing a decade of hands-on BI and analytics consulting experience to every weekend batch.
10
Years Experience
6
Batches Taught
0
Students Mentored
Student Reviews
No reviews yet, be the first to enroll and share your experience.
Requirements
- Comfortable in Excel (formulas, sorting, filtering). You don't need to have opened Power BI before
- A Windows laptop, ideally with 8 GB RAM. Power BI Desktop is free
- A working idea of revenue, cost and margin. We'll cover the rest
- Two to three hours a week at home for the deliverable. Students who skip these struggle by week five
Upcoming Batches
HPB-Weekend-Onsite-01
Faisal Adnan · Starts 17 Oct 2026
Saturday & Sunday · 8 weeks
HPB-Weekend-Online-01
Faisal Adnan · Starts 17 Oct 2026
Saturday & Sunday · 8 weeks
Fee by mode