
☰ Learn Artificial Intelligence Tutorial Menu
AI in Data Analytics and Business Intelligence
Written by Faisal Adnan · Updated 26 Sept 2026 · 5 min read
Will AI take the analyst's job? We get asked this at every intake session, and our honest answer is that it already took the boring half. Copilots in Excel and Power BI, plain-English SQL, automatic cleaning, forecasting, anomaly flags and narrative text now sit inside every step of the workflow. What's left is the half that was always the actual job. Knowing what to hand over, what to check, and what to keep. This lesson is about that split.
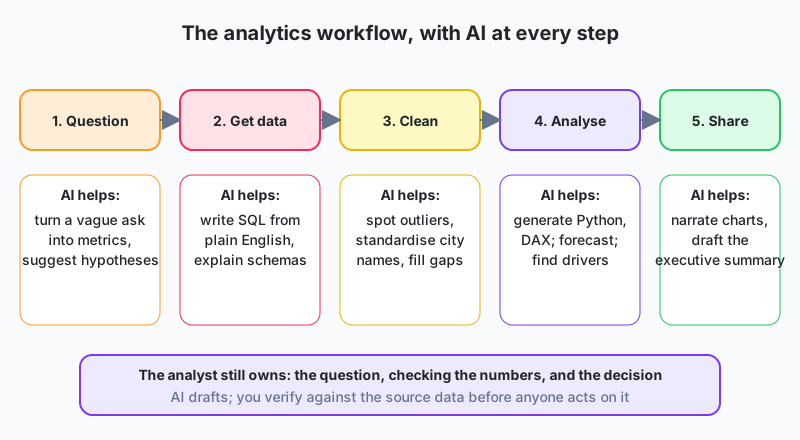
Where AI fits at each step
| Step | What AI does well | What you must still do |
|---|---|---|
| 1. Frame the question | Turn a vague request into candidate metrics and hypotheses | Confirm with the stakeholder what decision the analysis supports |
| 2. Get the data | Write SQL from plain English; explain unfamiliar schemas; suggest joins | Check row counts, joins and filters; know the data's quirks |
| 3. Clean | Detect outliers, standardise categories (city names), propose imputation, write the transformation code | Decide what an outlier means for the business; document decisions |
| 4. Analyse | Generate Python and DAX; forecast; find key drivers; build first-draft models | Validate against known numbers; sanity-check causality claims |
| 5. Share | Narrate charts; draft executive summaries; translate to Urdu; answer follow-up questions in a chat interface | Own the message and the recommendation; remove anything unverified |
The AI already in your tools
- Excel. Copilot writes and explains formulas, builds pivot tables from a sentence, and points out trends. Python in Excel runs pandas inside the sheet.
- Power BI. Copilot generates DAX measures, builds report pages from a prompt, writes narrative summaries, and answers plain-language questions over your semantic model. The built-in visuals include key influencers, decomposition trees and anomaly detection.
- SQL editors and warehouses. Plain-English-to-SQL assistants that read your schema, plus query explanation and tuning. The SQL track is where you learn to read what they produce.
- Notebooks and IDEs. Coding assistants and agents that write, run and fix analysis code and draw the charts.
- Chat assistants with tools. Upload a CSV, ask questions, get charts, then ask "why" and get a driver analysis, increasingly through MCP connectors straight into your databases.
The ML behind the buttons
A lot of the "AI" buttons in BI tools are classic ML wearing a nice icon. Key influencers fits a model to find which features move a metric most. Anomaly detection flags values outside a learned band. Forecasting fits a time-series model. Clustering groups customers. The earlier lessons let you judge those outputs. A driver analysis on biased data gives biased drivers, and a forecast trained on twelve months has never seen a full year of seasonality, whatever the confidence band says.
Reproduce the red dot yourself
Before you trust a dashboard's "anomaly detected" flag, you should be able to rebuild the idea. Here's a simple check on daily transaction counts for a mobile wallet, using a rolling mean and standard deviation in plain Python.
from statistics import mean, pstdev

daily = [1200, 1250, 1180, 1300, 1220, 1260, 1210, 1290, 2100, 1240, 1230, 1270]
window = 7
for i in range(window, len(daily)):
    past = daily[i - window:i]
    mu, sd = mean(past), pstdev(past)
    z = (daily[i] - mu) / sd if sd else 0
    flag = "ANOMALY" if abs(z) > 3 else ""
    print(f"day {i + 1}: {daily[i]:5d}  z={z:5.1f} {flag}")
Day 9 (2,100 transactions) gets flagged. The BI tool would show the same red dot. The difference is that now you can explain it ("more than three standard deviations above the previous week's average") and ask the right follow-up, whether there was a promotion or a duplicate load on day 9. That second question is the one your manager cares about.
Human in the loop
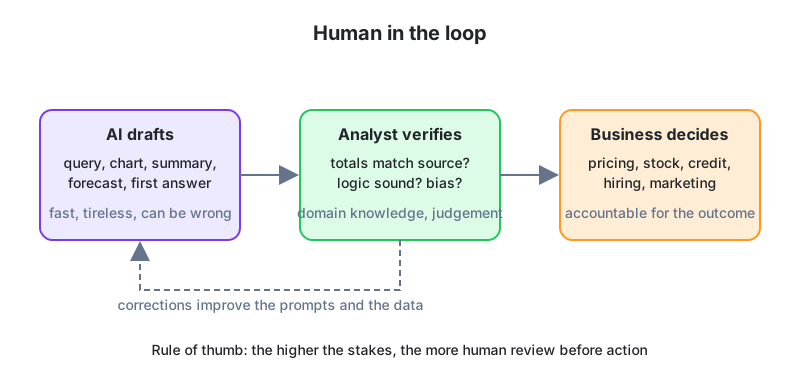
The working model now is AI drafts, analyst verifies, business decides, and the middle step is not optional. Four habits we insist on.
- Reconcile any AI-generated total against a figure you already trust (last month's board pack, the finance ledger).
- Read generated SQL before you run it. Joins and filters first.
- Ask the assistant to list its assumptions and to keep observation separate from speculation.
- Keep the prompts, the outputs and your edits. They become your documentation and, later, your training material for the next hire.
What gains value, what loses it
| Less valuable | More valuable |
|---|---|
| Memorising syntax | Knowing what the right query should return |
| Manual chart formatting | Choosing the right chart and the right message |
| Copy-pasting between tools | Designing workflows and connectors |
| Producing reports | Framing questions, verifying answers, influencing decisions |
One afternoon in a K-Electric billing team. An analyst was asked why complaints had jumped in one Karachi zone. She used a chat assistant connected to the billing warehouse to draft the SQL, pulled complaints, meter readings and outage logs, and asked for a driver analysis. It pointed at estimated (not actual) readings, which had doubled after a meter-reader shortage. She checked the counts against the field team's roster, built a Power BI page with a copilot-drafted narrative she corrected by hand, and recommended prioritising meter-reader hiring in that zone. One afternoon instead of a week, with every number verified. That last clause got her promoted, not the speed.
If you remember one thing
AI now helps at every step, from framing the question to narrating the result, and most "AI features" in BI tools are classic ML you already understand. The working model is AI drafts, analyst verifies, business decides, and the verification is your value. Framing questions, knowing the data, checking answers and explaining them gain worth every year. Memorising syntax loses it.
Try this before the next lesson
- Modify the anomaly script to use a z-score threshold of 2 and a window of 5. How many anomalies appear, and which threshold would you trust?
- Take a report you produce regularly and map each step to the table above: what would you hand to AI, and what checks would you keep?
- Write a prompt that asks an assistant to explain a DAX measure and list one edge case where it could mislead a manager.
Lesson 14 of 18
Sign in to track your progress and earn XP for every lesson you finish.