
☰ Learn Artificial Intelligence Tutorial Menu
Data: The Fuel of AI (collection, labelling, bias)
Written by Faisal Adnan · Updated 26 Sept 2026 · 5 min read
The first model I built for a client, a distributor in Lahore, took three days. The data took seven weeks. Every practitioner I've asked since gives the same answer. Models download in minutes, good data takes months. The good news for an analyst is that this is home ground. Cleaning, checking and documenting data is what you already do. Here's the pipeline, then the part most courses skip, which is how bias creeps in and multiplies.
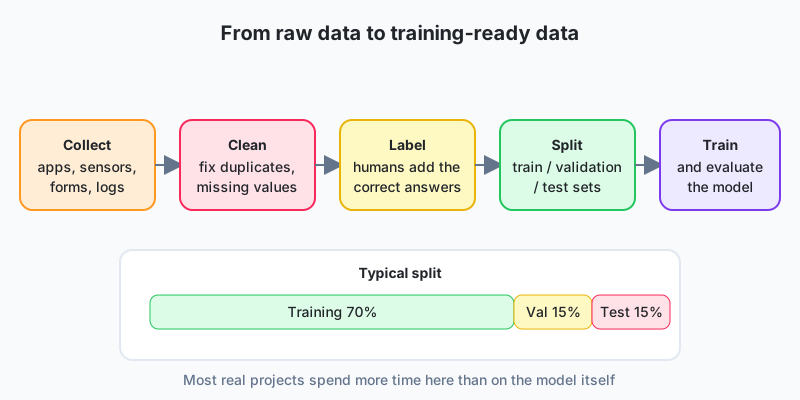
Step 1: collection
Training data comes from transaction systems, app logs, forms, sensors, cameras, documents and the public internet. Two questions decide whether any of it is usable.
- Is it representative? A Daraz seller who trains a demand model only on Ramadan sales will forecast terribly in Muharram.
- Are we allowed to use it? Customer data collected for billing may not be usable for a marketing model without consent. Pakistan's data-protection rules and the banking regulator increasingly want a documented purpose.
Step 2: cleaning
Real data is a mess. Duplicated rows, "Lahore", "LHR" and "lahore " as three cities, CNICs missing a digit, negative ages, timestamps in three time zones. Cleaning is ordinary analyst work. Standardise, deduplicate, decide what to do with missing values, and write down every decision. A model trained on dirty data learns the dirt.
Step 3: labelling
Supervised learning needs correct answers, and they have to come from somewhere.
| Source | Example | Cost and risk |
|---|---|---|
| Natural outcomes | Loan repaid or defaulted; order returned or not | Free, but delayed and sometimes biased (we only see outcomes for approved loans) |
| Human annotators | People draw boxes around fabric defects | Expensive; needs clear guidelines and quality checks |
| Existing systems | Old rule engine's decisions used as labels | Cheap, but the model inherits the old system's mistakes |
| AI-assisted labelling | An LLM pre-labels support tickets; humans correct | Fast; humans must review a sample to catch systematic errors |
Label quality caps model quality. If two annotators disagree 20% of the time, no model can agree with either much more than 80% of the time. Measure that disagreement before you spend a rupee on training.
Step 4: splitting
Split before you look too closely, or you'll fool yourself. A common split is 70% training, 15% validation (for choosing settings) and 15% test (touched once, at the end). For anything with dates, split by time. Train on January to September, test on October to December. A random split on a time series leaks the future into training and gives results that look wonderful and mean nothing.
Bias, and why it gets worse on its own
Bias in ML means systematic error that hits some groups harder than others. It nearly always comes in through the data.
- Historical bias: past decisions were unfair, and the data records them as normal.
- Representation bias: some groups are rare in the data (rural customers, Sindhi-language speakers, women borrowers), so the model is less accurate for them.
- Measurement bias: the proxy is wrong. Using "number of previous loans" as a sign of creditworthiness penalises people who never had bank access.
- Label bias: annotators bring their own assumptions.
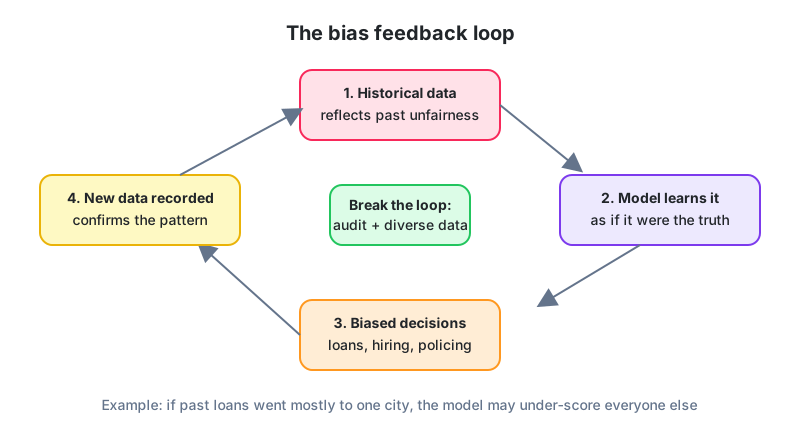
The dangerous bit is the feedback loop. A biased model makes biased decisions, those decisions produce new data that confirms the bias, and the next retraining bakes it in harder. Nothing breaks the loop by accident. You have to measure accuracy per group, collect data from the thin groups, and keep a human review step on any decision that changes someone's life.
Audit the data before you train on it
Before training a loan model, count outcomes by group. You're asking whether the data can support a fair model at all, and it takes ten lines.
from collections import Counter, defaultdict

rows = [
    ("Lahore", "M", 1), ("Lahore", "M", 1), ("Lahore", "F", 1), ("Lahore", "M", 0),
    ("Karachi", "M", 1), ("Karachi", "F", 0), ("Quetta", "M", 0), ("Quetta", "F", 0),
    ("Sukkur", "M", 1),
]  # (city, gender, approved)

by_city = defaultdict(lambda: [0, 0])
for city, gender, approved in rows:
    by_city[city][0] += approved
    by_city[city][1] += 1

for city, (yes, total) in sorted(by_city.items()):
    print(f"{city:8s} approved {yes}/{total} = {yes / total:.0%}")

print("gender counts:", Counter(g for _, g, _ in rows))
Lahore comes out at 75% approval, Quetta at 0%, and women are a third of the rows. A model trained on this will "learn" that Quetta means no, not because of anyone's actual risk but because the history is thin and skewed. The fix starts before modelling. Get more Quetta examples, add features that measure ability to repay, and watch approval rates by city after launch.
What the audit found at a Karachi microfinance provider. They trained a credit model on eight years of loans, and after launch approval rates for women fell. For years women had been offered smaller loans on stricter terms, so their recorded default rate reflected the terms, not their behaviour, and the model had learned the old policy as a fact about women. The team removed the loan-terms features, added repayment-history features from mobile-wallet data, and set up a monthly report of approval and default rates by gender and district. Approval rates levelled out within two quarters and defaults didn't rise.
If you remember one thing
Collection, cleaning, labelling and splitting are where the effort goes. Labels cap model quality, so measure how often your annotators disagree. Split by time for anything with dates, and never test on training data. Bias comes in through the data and multiplies through feedback loops, so audit per group before launch and keep auditing after.
Three things to try
- Take any dataset you have (sales, marks, attendance) and list five cleaning problems you would fix before training a model.
- Extend the audit snippet to compute approval rates by gender and by city-gender combination. Which combination has the least data?
- A Rawalpindi school wants to predict which students will drop out. Describe one historical, one representation and one measurement bias that could affect the model.
Lesson 6 of 18
Sign in to track your progress and earn XP for every lesson you finish.