
☰ Learn Data Warehouse Tutorial Menu
Data Warehouse Architecture: Sources, Staging, Core, Marts
Written by Faisal Adnan · Updated 26 Sept 2026 · 6 min read
The first warehouse I was handed as a junior had one schema and 340 tables. Raw extracts, half-cleaned copies and finished reporting tables sat side by side, and three of them were called sales_final. Nobody knew which to trust, so nobody trusted any of them. Layers fix that. A warehouse is a series of layers, each with one job, and data flows through them in one direction. Once you know the layers you can read any company's warehouse diagram, whatever tool built it.
The five layers
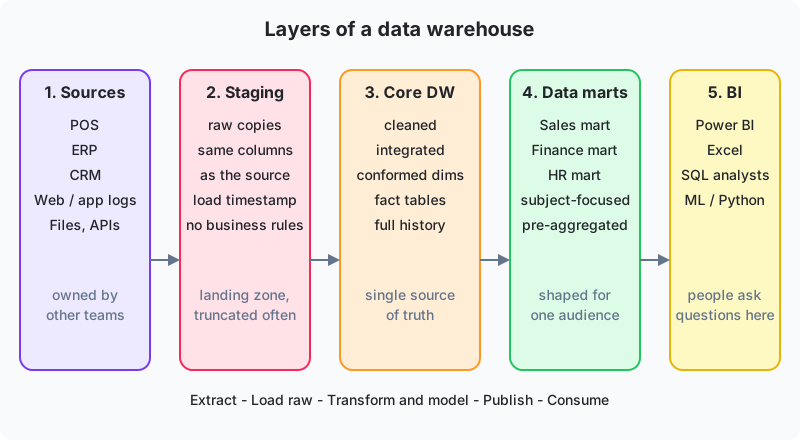
1. Source systems
The operational systems from Lesson 2, plus anything else with useful data. Spreadsheets, third-party APIs (courier tracking, payment gateways), log files, even the State Bank's exchange-rate page. The warehouse team doesn't own these and can't change them. Everything downstream has to cope with whatever they produce.
2. Staging (landing) area
The first stop inside the warehouse. Data is copied here exactly as it came, same column names and types as the source (usually all text), plus a load timestamp and the source file name. No business rules. Staging takes the load off the source quickly, gives you a copy to inspect when something looks wrong, and lets you re-run the transformation without touching the source again. Staging tables are often truncated and reloaded every run, though modern designs keep them as a permanent archive (Lesson 13 calls this the bronze layer). One habit we insist on in class is the _source_file column. The day a store sends you the same file twice with different totals, it's the only way to prove which one you loaded.
3. Core (integration) warehouse
The heart. Here data is cleaned, typed, deduplicated, matched across systems and modelled into facts and dimensions with consistent keys. This is the single source of truth, and full history lives here. If the core says a store sold PKR 1,214,560 on 14 August, every report agrees. The core is designed for correctness and coverage, not for one team's convenience.
4. Data marts
Subject-specific slices of the core, shaped for one audience. A sales mart for regional managers, a finance mart with fiscal periods and GL codes, an HR mart with anonymised headcount. Marts often add pre-aggregated tables (daily totals per store) so dashboards open instantly. Marts are derived from the core, always. The moment a mart loads directly from a source you've lost the single source of truth, and you're back to three tables called sales_final.
5. Presentation / BI
Power BI models, Excel connections, SQL notebooks, machine-learning feature extracts. This is where people ask questions. Business logic here should only be measures and formatting, never data cleaning.
Following one record through the layers
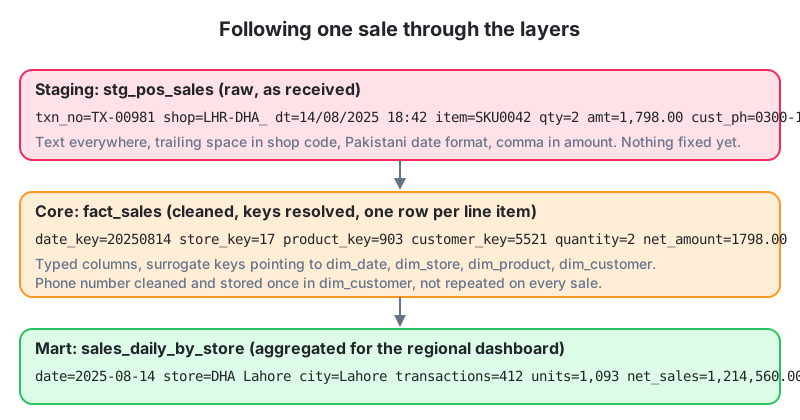
The diagram follows one sale. In staging it's messy text, with a store code carrying a trailing space, a date in dd/mm/yyyy form and an amount with a thousands separator. In the core it has become a typed fact row with integer keys pointing to the date, store, product and customer dimensions. In the mart it's been summed with 411 other sales into one daily row for the regional dashboard. Each layer is derived from the one before it and can be rebuilt from it when you find a bug. You will find bugs.
One table per layer, in SQL
-- Staging: everything is text, nothing is trusted
CREATE TABLE stg.pos_sales (
  txn_no       TEXT,
  shop         TEXT,
  dt           TEXT,
  item         TEXT,
  qty          TEXT,
  amt          TEXT,
  cust_ph      TEXT,
  _loaded_at   TIMESTAMP DEFAULT NOW(),
  _source_file TEXT
);

-- Core: typed, keyed, one row per receipt line
CREATE TABLE dw.fact_sales (
  date_key      INT      NOT NULL REFERENCES dw.dim_date(date_key),
  store_key     INT      NOT NULL REFERENCES dw.dim_store(store_key),
  product_key   INT      NOT NULL REFERENCES dw.dim_product(product_key),
  customer_key  INT      NOT NULL REFERENCES dw.dim_customer(customer_key),
  receipt_no    TEXT     NOT NULL,
  line_no       SMALLINT NOT NULL,
  quantity      INT      NOT NULL,
  net_amount    NUMERIC(12,2) NOT NULL,
  PRIMARY KEY (receipt_no, line_no)
);

-- Mart: pre-aggregated for the regional dashboard
CREATE TABLE mart_sales.daily_store_sales AS
SELECT f.date_key, s.store_name, s.city,
       COUNT(DISTINCT f.receipt_no) AS transactions,
       SUM(f.quantity)              AS units,
       SUM(f.net_amount)            AS net_sales
FROM dw.fact_sales f
JOIN dw.dim_store s ON s.store_key = f.store_key
GROUP BY f.date_key, s.store_name, s.city;
Schema names (stg, dw, mart_sales) make a table's layer obvious from its name. Analysts get read access to dw and the marts, never to stg. We learned that one the hard way, after an analyst built a board report on a staging table that got truncated at 2 am.
Two schools: Inmon and Kimball
| Inmon (top-down) | Kimball (bottom-up) | |
|---|---|---|
| Core design | Normalised (3NF) enterprise model | Dimensional (star schemas) from the start |
| Marts | Built from the normalised core | Marts are the warehouse; joined by conformed dimensions ("bus") |
| First delivery | Slower; the whole model first | Faster; one business process at a time |
| Best for | Very large, regulated enterprises | Most companies, BI-led teams |
This track follows Kimball, because it's what most Pakistani BI teams practise and what Power BI expects. You'll still meet Inmon-style cores in banks and telcos, usually with a Kimball-style mart layer on top.
Tracing one disputed figure at a utility: a K-Electric-style billing operation produces meter readings, bills, payments and complaints from four different applications. A layered warehouse lands each feed in staging every night, matches consumer numbers across systems in the core (the same consumer appears with different formatting in each), and publishes a revenue-assurance mart that compares units billed with units paid per feeder. When a regional office disputes a number, the team traces it from the mart row to the core row to the staging record to the original file in minutes. Without staging, that trace ends at "the source must have sent something different", which convinces nobody.
Before you move on
Data flows one way, from sources through staging and the core to marts and BI, and each layer is built from the one before it. Staging holds raw, untrusted copies with load metadata and no business rules. The core is the single source of truth, cleaned, keyed and historical. Marts are audience-specific views built from the core, never from sources. Schema names make the layer obvious, and access is granted by layer.
Three things to try
- A colleague proposes loading the finance mart directly from the ERP "because it's faster". List three problems this causes.
- Design staging, core and mart tables (column names only) for a Rawalpindi school's exam results, where the sources are a results Excel per class and a student register.
- Write a query against the mart in the worked example that returns, for each city, the best-selling day in August 2025 (date_key between 20250801 and 20250831).
Lesson 3 of 18
Sign in to track your progress and earn XP for every lesson you finish.