
☰ Learn Data Warehouse Tutorial Menu
Dimensional Modelling: Facts and Dimensions
Written by Faisal Adnan · Updated 26 Sept 2026 · 5 min read
Here's a report request, copied almost word for word from a merchandising manager we worked with. "I want revenue and units by store, by category, by month, for the last two years, and I want to filter by brand." Read it again. Underline the numbers she wants to add up, then circle the words after each "by". You've just done dimensional modelling. Ralph Kimball popularised the method, and it rests on that one split, the numbers you measure and the context that describes them. Once you see questions that way, designing tables is close to mechanical.
Reading a question dimensionally
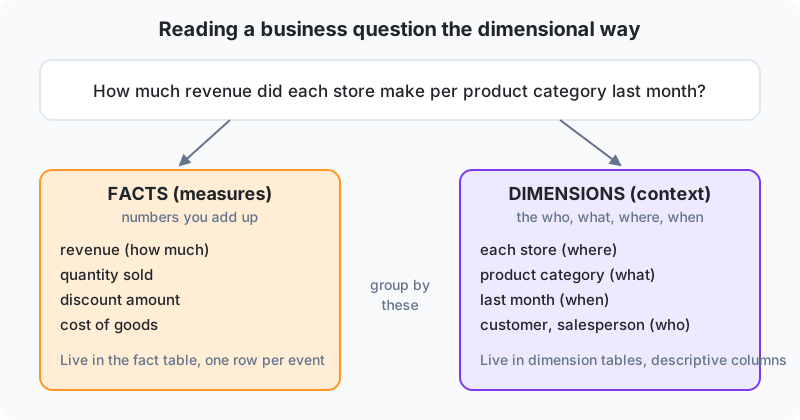
The diagram does the same exercise on "How much revenue did each store make per product category last month?" "How much revenue" is a measurement, a number you add up. "Each store", "product category" and "last month" are the ways you want to slice it.
- Facts (or measures) are the numeric measurements of a business event. Revenue, quantity, cost, discount, minutes, count. They live in a fact table, one row per event.
- Dimensions are the descriptive context. Who, what, where, when, how. They live in dimension tables, one row per thing (one row per store, per product, per customer, per day).
Every "by" or "per" in a business question points to a dimension. Every "how much" or "how many" points to a fact. Try it on the next report request in your inbox. When it doesn't work, the request itself is usually muddled.
Fact tables
A fact table is narrow in meaning and long in rows. It has only two kinds of column, foreign keys to dimensions and numeric measures. Make facts additive wherever you can, meaning they can be summed across any dimension. Quantity sold is additive. Unit price isn't (adding up unit prices across a month means nothing), so store the extended amount (quantity times price) and derive average price when you need it.
| Additivity | Meaning | Example |
|---|---|---|
| Fully additive | Sum across every dimension | net_amount, quantity |
| Semi-additive | Sum across some dimensions, not time | account balance, stock on hand (you cannot add Monday's and Tuesday's balance) |
| Non-additive | Never sum; recompute from components | percentages, ratios, unit prices |
Dimension tables
A dimension table is wide in meaning and short in rows. dim_product for a retailer might have 20,000 rows and 30 columns. SKU, name, category, subcategory, brand, size, colour, fabric, supplier, launch season, unit cost. Every one of those is a possible filter, group-by or row header in a report. Good dimensions are verbose. Full words ("Lawn suit"), not codes ("LS"), because a manager will read them on a chart axis. Keep the codes as extra columns.
Dimensions also carry hierarchies. Day to month to quarter to year; SKU to subcategory to category; store to city to region. Storing all the levels as columns on one row (denormalised) is deliberate. It lets a user drag "Region" onto a chart without a join.
Why not keep the normalised design?
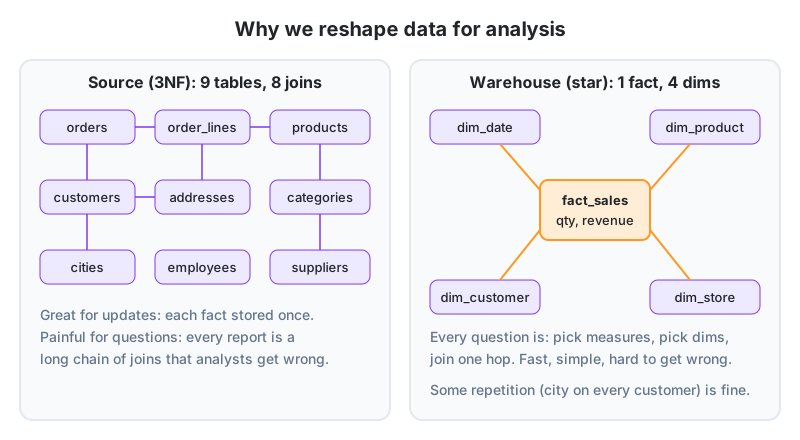
The source system is normalised (3NF) so each fact is stored once and updates are cheap. That's right for OLTP. For analysis it means every report is a chain of eight joins that analysts get wrong, and they get it wrong quietly. Miss a join and rows vanish; add a wrong one and they double. The dimensional model repeats some text (the city name sits on every customer row) in exchange for a design where every question is one hop from the fact. Storage is cheap. Analyst mistakes aren't.
Modelling a call centre
A telecom call centre in Islamabad wants to analyse calls. The questions are average handling time by agent by hour, calls per reason by city, and first-call resolution by team by week. Read them dimensionally:
| Phrase | Type | Table |
|---|---|---|
| handling time, calls (count), resolved (0/1) | facts | fact_call |
| agent, team | dimension | dim_agent (team as a column) |
| hour, week | dimension | dim_date and dim_time |
| reason | dimension | dim_call_reason |
| city (of the customer) | dimension | dim_customer (city as a column) |
CREATE TABLE dw.fact_call (
  date_key          INT  NOT NULL,   -- dim_date
  time_key          INT  NOT NULL,   -- dim_time (one row per minute of day)
  agent_key         INT  NOT NULL,   -- dim_agent
  customer_key      INT  NOT NULL,   -- dim_customer
  reason_key        INT  NOT NULL,   -- dim_call_reason
  call_id           TEXT NOT NULL,   -- degenerate dimension
  handling_seconds  INT  NOT NULL,   -- additive
  hold_seconds      INT  NOT NULL,   -- additive
  is_resolved       SMALLINT NOT NULL, -- 1/0, additive: SUM = resolved calls
  call_count        SMALLINT NOT NULL DEFAULT 1 -- makes COUNT explicit
);

-- First-call resolution by team by week
SELECT d.year, d.week_of_year, a.team_name,
       SUM(f.is_resolved) * 100.0 / SUM(f.call_count) AS fcr_pct
FROM dw.fact_call f
JOIN dw.dim_date d  ON d.date_key  = f.date_key
JOIN dw.dim_agent a ON a.agent_key = f.agent_key
GROUP BY d.year, d.week_of_year, a.team_name
ORDER BY 1, 2, 3;
The is_resolved flag stored as 1/0 is a small trick worth keeping. It turns a yes/no into an additive fact, so a percentage is one SUM divided by another. The call_count column that's always 1 looks silly until a BI tool needs an explicit measure to sum, and then you'll be glad it's there.
A distributor's 40-column export: a Peshawar pharmaceutical distributor asked us for "sales by medicine by doctor by area by month". Mapping it took ten minutes. One fact table (invoice lines with quantity, value and bonus units) and four dimensions (product, doctor, territory, date). The old approach was a 40-column Excel export where doctor names were typed differently on every invoice, so "Dr Khan", "DR. KHAN" and "Khan Sb" were three doctors. Building
dim_doctoronce, with a cleaned name and a territory, fixed the grouping problem for good.
The short version
Every business question splits into facts (numbers to add up) and dimensions (context to slice by). Fact tables are long and narrow, foreign keys plus additive measures, one row per event. Dimension tables are short and wide, with verbose columns and flattened hierarchies. Store extended amounts rather than unit prices, store yes/no as 1/0, and accept repeated text in dimensions as the price of simple, safe queries.
Practice on paper
- Split this into facts and dimensions: "Average delivery time per courier per city per week for orders above PKR 5,000."
- Classify as fully additive, semi-additive or non-additive: units in stock, discount amount, margin percentage, number of students present, temperature reading.
- Design fact_attendance for a school. List its foreign keys and measures, then write a query giving attendance percentage per class per month.
Lesson 5 of 18
Sign in to track your progress and earn XP for every lesson you finish.