
☰ Learn Data Warehouse Tutorial Menu
End-to-End Case Study: Building a Retail Sales Warehouse
Written by Faisal Adnan · Updated 26 Sept 2026 · 9 min read
Time to put the whole track on one project. "Sitara Fashions" is a made-up name, but the shape is a client we know well. A Pakistani clothing retailer with 42 stores in Lahore, Karachi, Islamabad, Faisalabad and Multan, an online shop and a loyalty app. We'll follow the project from the first interviews to the dashboard the CEO opens at 8 am, and point out where each earlier lesson was applied. Treat it as the template for your own first warehouse.
Step 1: Requirements
The team interviewed the CEO, the two regional heads, the merchandising manager, the finance controller and three store managers. Interviews ask about decisions, not reports. "What do you decide every week, and what do you wish you knew?" Ask "what reports do you want?" instead and you'll get a list of the Excel files they already have. The answers, grouped:
| Who | Decision | Needs |
|---|---|---|
| CEO, regional heads | Where to open, close or refit stores; regional targets | Net sales vs target by region and store, YoY, margin by category, monthly trend |
| Merchandising | What to reorder, what to mark down | Sell-through by SKU and size, slow stock, return rates by product |
| Finance | Month close, audit | Net sales reconciled to POS and ledger, fiscal periods, discounts and refunds separately |
| Store managers | Daily staffing, local promotions | Yesterday by hour, basket size, sales per staff member, own store only |
The sources were the POS (SQL Server, 42 stores replicated nightly to head office), the ERP (products, costs, purchase orders), the loyalty app (REST API, customers and points), the online shop (Shopify export) and an HR Excel file of staff by store. Three pain points were written down in week one. Store codes differ between POS and ERP. The loyalty app and POS identify customers by phone number in different formats. Returns are recorded as negative sales in POS with no link to the original receipt. That last one decides the returns design later, so it's worth catching early.
Step 2: Bus matrix and phase scope
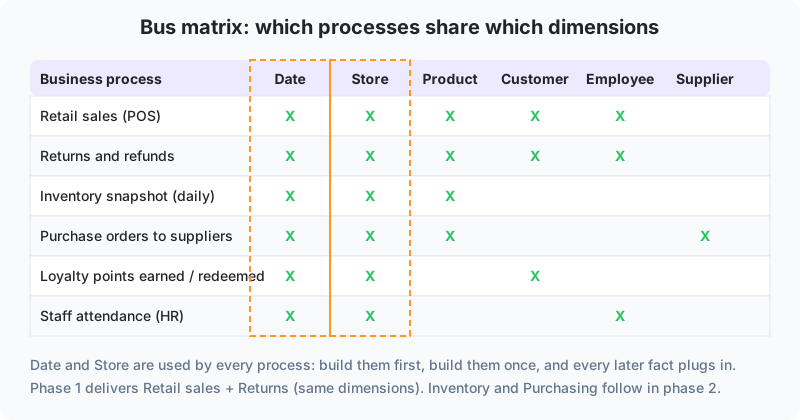
The bus matrix lists each business process against the conformed dimensions it needs. Date and Store appear in every row, so they're built first and once. Phase 1 (10 weeks) delivers retail sales and returns, which share all their dimensions and answer the CEO's and finance's questions. Inventory snapshots and purchasing follow in Phase 2 once merchandising trusts the numbers. Loyalty and HR come later. Small phases that ship a working dashboard are how warehouse projects survive. The ones that try to model everything first tend to get cancelled around month eight.
Step 3: Dimensional design
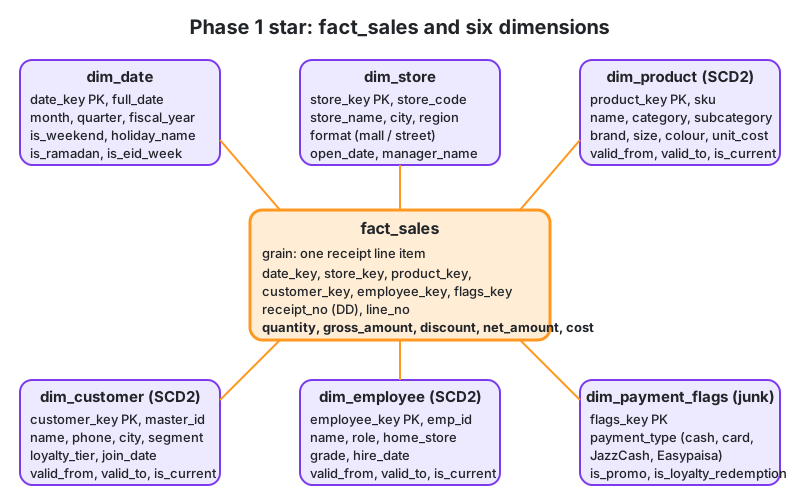
Apply the four steps from Lesson 7. The process is retail sales. The grain is one row per line item on a receipt. The dimensions are date, time, store, product, customer, employee (cashier) and payment flags. The facts are quantity, gross amount, discount, net amount and cost. Returns get their own transaction fact at the same grain with an original_receipt_no degenerate dimension (NULL when the POS didn't capture it). SCD types were chosen per attribute. Product category and unit cost are Type 2, because merchandising re-categorises each season and margin must use the cost at the time of sale. Customer city and loyalty tier are Type 2. Employee store and grade are Type 2. Names are Type 1.
SQL DDL for the star schema
CREATE SCHEMA dw;

CREATE TABLE dw.dim_date (
  date_key        INT PRIMARY KEY,           -- 20250814
  full_date       DATE NOT NULL UNIQUE,
  day             SMALLINT NOT NULL,
  day_name        TEXT NOT NULL,
  month           SMALLINT NOT NULL,
  month_name      TEXT NOT NULL,
  quarter         SMALLINT NOT NULL,
  year            SMALLINT NOT NULL,
  year_month      INT NOT NULL,
  fiscal_year     SMALLINT NOT NULL,         -- FY ending June
  fiscal_month_no SMALLINT NOT NULL,
  is_weekend      BOOLEAN NOT NULL,
  holiday_name    TEXT,
  is_ramadan      BOOLEAN NOT NULL DEFAULT FALSE,
  is_eid_week     BOOLEAN NOT NULL DEFAULT FALSE
);

CREATE TABLE dw.dim_time (
  time_key     SMALLINT PRIMARY KEY,         -- minute of day 0..1439
  hour_of_day  SMALLINT NOT NULL,
  minute       SMALLINT NOT NULL,
  shift_name   TEXT NOT NULL                 -- Morning / Afternoon / Evening
);

CREATE TABLE dw.dim_store (
  store_key     INT GENERATED ALWAYS AS IDENTITY PRIMARY KEY,
  store_code    TEXT NOT NULL,               -- POS natural key
  erp_branch_id TEXT,                        -- ERP natural key
  store_name    TEXT NOT NULL,
  city          TEXT NOT NULL,
  region        TEXT NOT NULL,               -- North / Central / South
  format        TEXT NOT NULL,               -- Mall / Street / Online
  open_date_key INT REFERENCES dw.dim_date(date_key),
  is_active     BOOLEAN NOT NULL DEFAULT TRUE
);

CREATE TABLE dw.dim_product (
  product_key  INT GENERATED ALWAYS AS IDENTITY PRIMARY KEY,
  sku          TEXT NOT NULL,
  product_name TEXT NOT NULL,
  category     TEXT NOT NULL,
  subcategory  TEXT NOT NULL,
  brand        TEXT NOT NULL,
  size         TEXT,
  colour       TEXT,
  unit_cost    NUMERIC(10,2) NOT NULL,
  valid_from   DATE NOT NULL,
  valid_to     DATE NOT NULL DEFAULT DATE '9999-12-31',
  is_current   BOOLEAN NOT NULL DEFAULT TRUE
);

CREATE TABLE dw.dim_customer (
  customer_key  INT GENERATED ALWAYS AS IDENTITY PRIMARY KEY,
  master_id     TEXT NOT NULL,               -- golden record id
  phone         TEXT,                        -- normalised 03xxxxxxxxx
  customer_name TEXT,
  city          TEXT,
  segment       TEXT,
  loyalty_tier  TEXT,
  join_date_key INT REFERENCES dw.dim_date(date_key),
  valid_from    DATE NOT NULL,
  valid_to      DATE NOT NULL DEFAULT DATE '9999-12-31',
  is_current    BOOLEAN NOT NULL DEFAULT TRUE
);

CREATE TABLE dw.dim_employee (
  employee_key INT GENERATED ALWAYS AS IDENTITY PRIMARY KEY,
  emp_id       TEXT NOT NULL,
  emp_name     TEXT NOT NULL,
  role         TEXT NOT NULL,
  home_store_key INT REFERENCES dw.dim_store(store_key),
  grade        TEXT,
  valid_from   DATE NOT NULL,
  valid_to     DATE NOT NULL DEFAULT DATE '9999-12-31',
  is_current   BOOLEAN NOT NULL DEFAULT TRUE
);

CREATE TABLE dw.dim_payment_flags (
  flags_key             INT GENERATED ALWAYS AS IDENTITY PRIMARY KEY,
  payment_type          TEXT NOT NULL,       -- Cash / Card / JazzCash / Easypaisa / COD
  is_promo              BOOLEAN NOT NULL,
  is_loyalty_redemption BOOLEAN NOT NULL,
  UNIQUE (payment_type, is_promo, is_loyalty_redemption)
);

CREATE TABLE dw.fact_sales (
  receipt_no    TEXT NOT NULL,
  line_no       SMALLINT NOT NULL,
  date_key      INT NOT NULL REFERENCES dw.dim_date(date_key),
  time_key      SMALLINT NOT NULL REFERENCES dw.dim_time(time_key),
  store_key     INT NOT NULL REFERENCES dw.dim_store(store_key),
  product_key   INT NOT NULL REFERENCES dw.dim_product(product_key),
  customer_key  INT NOT NULL REFERENCES dw.dim_customer(customer_key),
  employee_key  INT NOT NULL REFERENCES dw.dim_employee(employee_key),
  flags_key     INT NOT NULL REFERENCES dw.dim_payment_flags(flags_key),
  quantity      INT NOT NULL,
  gross_amount  NUMERIC(12,2) NOT NULL,
  discount      NUMERIC(12,2) NOT NULL DEFAULT 0,
  net_amount    NUMERIC(12,2) NOT NULL,
  cost          NUMERIC(12,2) NOT NULL,
  PRIMARY KEY (receipt_no, line_no)
) PARTITION BY RANGE (date_key);

CREATE TABLE dw.fact_returns (
  return_no           TEXT NOT NULL,
  line_no             SMALLINT NOT NULL,
  date_key            INT NOT NULL REFERENCES dw.dim_date(date_key),
  store_key           INT NOT NULL REFERENCES dw.dim_store(store_key),
  product_key         INT NOT NULL REFERENCES dw.dim_product(product_key),
  customer_key        INT NOT NULL REFERENCES dw.dim_customer(customer_key),
  original_receipt_no TEXT,
  quantity_returned   INT NOT NULL,
  refund_amount       NUMERIC(12,2) NOT NULL,
  PRIMARY KEY (return_no, line_no)
);
Step 4: Pipeline
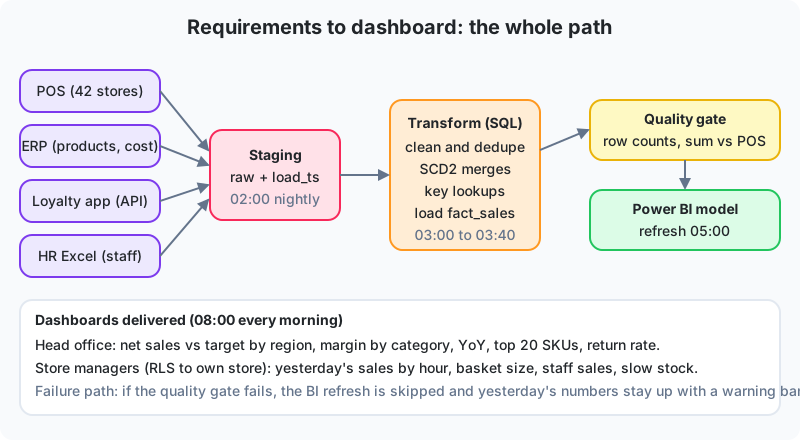
The pipeline is ELT on PostgreSQL (the client's budget), with Python for extraction and SQL for everything else, orchestrated by Airflow. Each night runs in this order. At 1 am, extract deltas from POS by updated_at, a full extract of ERP products (12,000 rows), an API pull of loyalty customers changed since yesterday, and the HR file if a new one was dropped. At 2 am, land everything in stg. At 3 am, Type 2 merges for product, customer and employee, then fact loads with key lookups, the unknown row for unmatched customers (about 60 percent of cash sales have no loyalty phone), and returns matched to original receipts where possible. At 3:40, the quality gate. Row counts against the extract, sum of net_amount against the POS day-end report per store within one rupee, no duplicate receipt lines, freshness. At 4 am, build gold aggregates. At 5 am, Power BI refresh. If the gate fails, the refresh is skipped, yesterday's model stays live, and a banner on the dashboard says "Data as of 13 August; load issue under investigation". That banner bought more goodwill with the CEO than any feature we shipped.
Step 5: Dashboard
One certified Power BI semantic model on the star schema, with measures for Net Sales, Gross Margin, Margin %, Sales vs Target, YoY, Return Rate and Units per Receipt, fiscal time intelligence on dim_date, and RLS from a store-manager mapping table. Two thin reports. An executive page (region and store performance, category margin, trend, top and bottom SKUs) and a store-manager page (yesterday by hour, basket size, staff sales, returns). Excel users connect to the same model.
-- The CEO's first question, answered from the star
SELECT s.region, s.store_name,
       SUM(f.net_amount)                      AS net_sales,
       SUM(f.net_amount - f.cost)             AS gross_margin,
       SUM(r.refund_amount)                   AS refunds
FROM dw.fact_sales f
JOIN dw.dim_date d  ON d.date_key  = f.date_key
JOIN dw.dim_store s ON s.store_key = f.store_key
LEFT JOIN (SELECT store_key, date_key, SUM(refund_amount) AS refund_amount
           FROM dw.fact_returns GROUP BY store_key, date_key) r
       ON r.store_key = f.store_key AND r.date_key = f.date_key
WHERE d.fiscal_year = 2026 AND d.fiscal_month_no <= 2   -- Jul to Aug FY26
GROUP BY s.region, s.store_name
ORDER BY net_sales DESC;
Week 6, and the ledger doesn't match: the finance controller found the warehouse's net sales 0.4 percent higher than the ledger. Tracing back through staging showed the POS in two Karachi stores was double-posting voided receipts. The warehouse's quality gate had flagged it. The POS vendor hadn't noticed in two years. Fixing the source recovered a small tax over-payment and, more importantly, convinced finance that the warehouse was more reliable than the reports they'd been using. That's the moment a warehouse project stops being "the IT thing" and starts being the numbers.
What the project taught, in five lines
- Start with decisions and pain points, not report lists, and find source mismatches early.
- Use a bus matrix to pick a small first phase that shares conformed dimensions and ships a real dashboard.
- Declare grain, choose SCD types per attribute, use surrogate, junk and degenerate dimensions, write the DDL.
- Load dimensions then facts, gate on quality against an independent total, and fail safely.
- Publish one semantic model with measures and RLS, thin reports on top, and reconcile to finance to earn trust.
Weekend homework
- Add Phase 2 (daily inventory snapshot) to the design. Write the grain sentence and the fact DDL, and say which existing dimensions it reuses.
- Write the quality-gate query that compares net_amount per store per day in fact_sales with a staging table stg.pos_dayend(store_code, business_date, total_net) and lists any mismatch above one rupee.
- The CEO asks "which stores are growing fastest year over year?" Write the SQL using dim_date.year_month or the fiscal columns.
Lesson 17 of 18
Sign in to track your progress and earn XP for every lesson you finish.