
☰ Learn Machine Learning Tutorial Menu
Feature Engineering
Written by Faisal Adnan · Updated 26 Sept 2026 · 5 min read
Ask an experienced Lahore shopkeeper whether a customer will come back. He won't quote the raw purchase log. He'll say "she buys every second Friday, spends more before Eid, and complained once". Those are features, compact signals built from raw data, and building them is the biggest single lever you have on model quality. We tell every batch the same thing: a logistic regression with good features beats a fancy model with raw columns, and we've yet to see a client project that disproved it.
Why raw columns are not enough
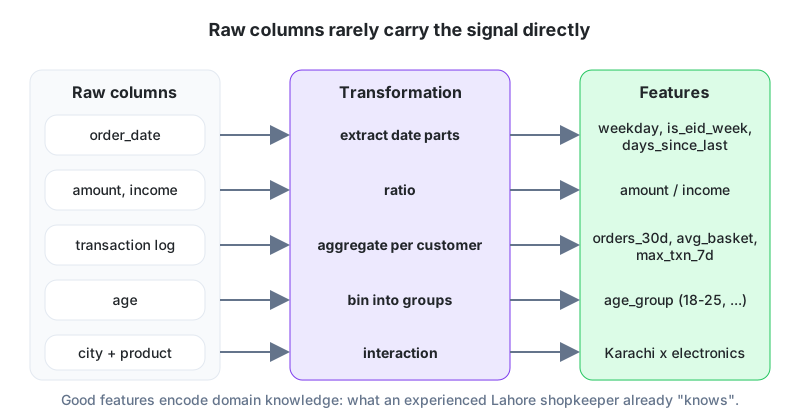
A model sees only the columns you hand it. It can't know that 2024-04-10 was Eid, that a 15,000 rupee instalment against a 20,000 income is dangerous, or that a card has had three transactions in the last hour, unless you compute those things. Feature engineering is domain knowledge written as numbers.
The main families of features
| Family | What you do | Examples |
|---|---|---|
| Date/time parts | split a timestamp | hour, weekday, is_weekend, days_to_eid, days_since_last_order |
| Ratios and differences | combine two numbers | loan / income, price vs category average, this month minus last month |
| Aggregations | summarise a log per entity | orders_30d, avg_basket_90d, max_txn_7d, distinct_merchants_24h |
| Binning | numbers into groups | age 18-25 / 26-35 / 36+, income quintiles |
| Text and flags | extract simple signals | contains "urgent", has_email, cnic_valid_format |
| Interactions | multiply or pair features | Karachi x electronics, weekend x night |
| Target-derived | use past outcomes (carefully) | customer's historical return rate up to yesterday |
The trap that fools everyone once: leakage
A feature that would not exist at prediction time is leakage. It gives you a wonderful test score and a useless model. Classic cases we've seen in student projects: "account_closed_date" used to predict churn, "refund_amount" used to predict a return, and a customer's transaction count that includes the very transaction being classified.
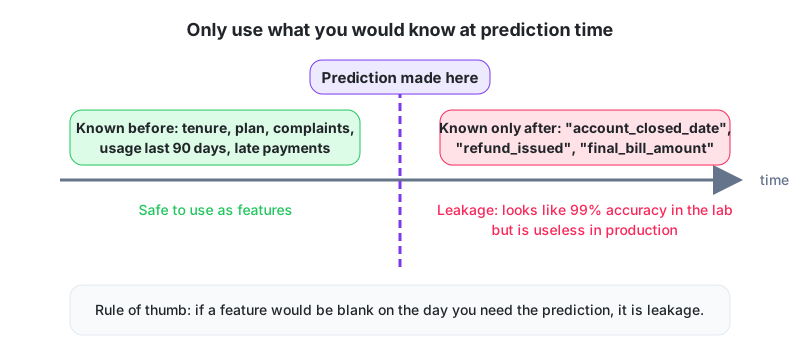
The defence is a cut-off timestamp for every row. Compute features only from data strictly before it, no exceptions.
From a raw log to seven features
Here is the order log for customer C-17, with a cut-off date of 1 March 2025.
| Order date | Amount (PKR) | Returned? |
|---|---|---|
| 2024-11-20 | 3,200 | No |
| 2024-12-28 | 5,500 | Yes |
| 2025-01-15 | 2,100 | No |
| 2025-02-20 | 4,000 | No |
| 2025-03-09 | 1,500 | No |
Only the first four rows sit before the cut-off. The 9 March order is out, because it's in the future relative to the prediction moment. The features for C-17 come out as follows.
| Feature | Calculation | Value |
|---|---|---|
| orders_90d | orders between 1 Dec and 28 Feb | 3 |
| spend_90d | 5,500 + 2,100 + 4,000 | 11,600 |
| avg_basket | (3,200 + 5,500 + 2,100 + 4,000) / 4 | 3,700 |
| days_since_last | 1 Mar minus 20 Feb | 9 |
| avg_gap_days | (38 + 18 + 36) / 3 | 30.7 |
| return_rate | 1 / 4 | 0.25 |
| spend_trend | last 45 days (4,000) vs previous 45 days (7,600) | -47% |
The label is "did C-17 order in the 60 days after 1 March?" (yes, on 9 March, so churned = 0). Notice the spend trend of -47%. A raw log never shows that directly, and it's exactly the kind of thing the shopkeeper would have mentioned.
Doing it with pandas
# run locally
import pandas as pd

orders = pd.read_csv("orders.csv", parse_dates=["order_date"])
cutoff = pd.Timestamp("2025-03-01")
past = orders[orders.order_date < cutoff]
recent = past[past.order_date >= cutoff - pd.Timedelta(days=90)]

feats = past.groupby("customer_id").agg(
    avg_basket=("amount", "mean"),
    return_rate=("returned", "mean"),
    last_order=("order_date", "max"),
)
feats["days_since_last"] = (cutoff - feats["last_order"]).dt.days
feats["orders_90d"] = recent.groupby("customer_id").size()
feats["orders_90d"] = feats["orders_90d"].fillna(0)
print(feats.head())
Fewer features, better model
More features aren't automatically better. Irrelevant columns add noise, slow training and open new leakage doors. Three cheap ways to prune. Drop features with near-zero variance or that nearly duplicate another (correlation above 0.95). Rank features by a tree model's importance and cut the tail. Remove features one at a time and keep the removal when the validation score holds. A model with 15 features the business can explain is easier to deploy and monitor than one with 300, and in our experience it scores about the same.
Four signs a feature is earning its place
- Its distribution differs between classes (churners have a larger days_since_last).
- The validation score improves when it is added and drops when it is removed.
- A domain expert nods when you describe it.
- It is available on time in production, at the same cost.
The feature that gave a fraud model eyes: A Karachi bank's fraud team had a model using only transaction amount, merchant type and hour of day, and recall was poor. The analysts added velocity features computed per card over the previous 24 hours, namely the number of transactions, the number of distinct cities, and the ratio of this amount to the card's 30-day average. Fraud recall at the same alert volume rose from 41% to 68%. The algorithm never changed. The features gave it the "this card was in Lahore ten minutes ago and is now in Quetta" signal investigators had always spotted by eye.
If you remember one thing
Features carry domain knowledge, and they matter more than the algorithm. Build dates, ratios, aggregations, bins and interactions from raw columns, always behind a cut-off so nothing from the future leaks in. The question to ask of every column is "would this be blank on prediction day?" If yes, it's leakage no matter how good the test score looks. Judge a feature by validation gain and by whether production can supply it on time, not by how clever it sounds in a meeting.
Homework
- From a JazzCash transaction log (user, timestamp, amount, receiver), design five features for detecting account takeover. Mark which need a rolling window.
- Recompute the C-17 features with a cut-off of 1 February 2025 instead of 1 March.
- For a school results model, decide whether each is leakage: attendance to date, mid-term marks, final board grade, teacher's predicted grade written before the exam.
Lesson 5 of 18
Sign in to track your progress and earn XP for every lesson you finish.