
☰ Learn Machine Learning Tutorial Menu
The Machine Learning Workflow (CRISP-DM)
Written by Faisal Adnan · Updated 26 Sept 2026 · 5 min read
The first ML project I watched die had a perfectly good model. It died because nobody had agreed what "success" meant, the finance team never trusted the data, and the scores sat in a folder nobody opened. CRISP-DM (Cross-Industry Standard Process for Data Mining) is a 25-year-old checklist that still describes how good teams avoid that ending. We'll walk its six stages with one concrete churn project so you can run the same loop on your own work.
The six stages
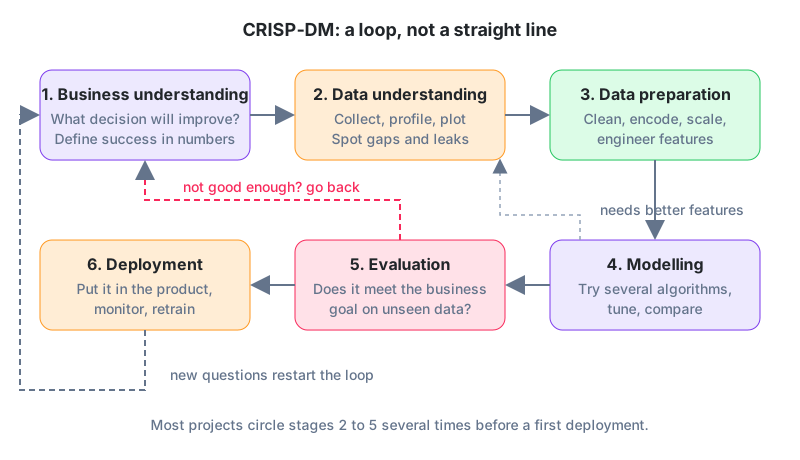
| Stage | Question it answers | Concrete output |
|---|---|---|
| 1. Business understanding | Which decision will change, and how will we measure the gain? | One-page brief: decision, metric, baseline, constraints |
| 2. Data understanding | What data exists, how good is it, does it contain the target? | Data dictionary, missing-value report, first plots |
| 3. Data preparation | How do we make it model-ready and repeatable? | Cleaning + feature script that runs end to end |
| 4. Modelling | Which algorithm and settings work best? | Baseline plus two or three candidates with CV scores |
| 5. Evaluation | Does it beat the baseline on unseen data and does the business agree? | Test-set metrics translated into rupees or hours |
| 6. Deployment | How does the prediction reach the person who acts on it? | Scheduled scoring job or API, monitoring, retraining plan |
Stage 1 is the one beginners skip
"Predict churn" is not a business goal, and in our batches it's the line students write most often. A brief that can actually be signed off looks like this:
- Decision: each Monday the retention team calls 500 customers. Which 500?
- Metric: customers retained per 500 calls (today: 40 using the agents' own picks).
- Baseline: the current manual list, or a simple rule such as "longest since last purchase".
- Constraints: scores must be ready by 8 a.m. Monday; no use of gender or religion features.
Now "good enough" has a number. The model must beat 40 retained per 500 calls, and everyone knows it on day one.
How each stage goes wrong
| Stage | Typical failure | Cheap prevention |
|---|---|---|
| Business understanding | "Build a churn model" with no owner for the calls | Name the person who will act on the output and ask what they need |
| Data understanding | The label column is filled in by a process that already uses the features | Trace where every column comes from and when it is written |
| Data preparation | Manual fixes in Excel that cannot be repeated next month | Every transformation is a script from day one |
| Modelling | Weeks spent tuning a fancy model before a baseline exists | Baseline first, ship it to a dashboard, then improve |
| Evaluation | Reporting accuracy on a random split of time-ordered data | Split by time and by entity; report the business metric |
| Deployment | Model lives in one analyst's laptop | Scheduled job, versioned model file, a monitoring query |
Where the weeks actually go
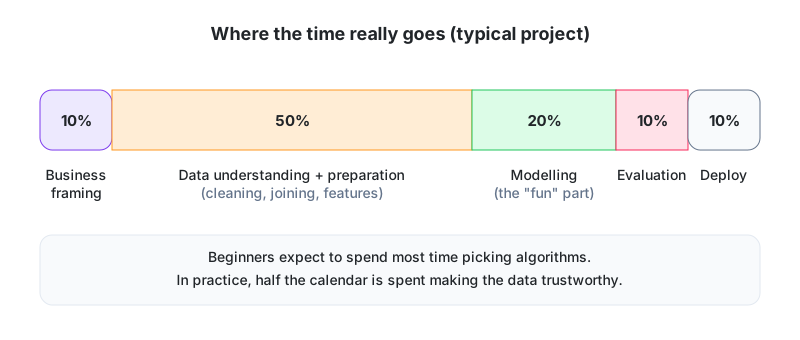
Plan for half the calendar to go on data. Joining the CRM to the billing system and the complaints log is slow, and every join turns up a surprise. Customer IDs that changed format in 2022. Timestamps in local time on one server and UTC on another. A "status" column that three departments fill in differently. None of it is glamorous, and all of it decides whether the model works.
Stage 5 in numbers
Say stage 5 of the churn project produced these results on a held-out month of 10,000 customers, of whom 800 actually churned.
| Approach | Churners in top 500 | Precision of the list | Retained (assume 25% of contacted churners stay) |
|---|---|---|---|
| Random 500 | 500 x 8% = 40 | 8% | 10 |
| Rule: longest since purchase | 160 | 32% | 40 |
| Logistic regression | 230 | 46% | 57.5 |
| Gradient boosting | 265 | 53% | 66.25 |
Put it in rupees. If an average retained customer is worth PKR 6,000 a year, gradient boosting retains about 26 more customers per week than the rule (66.25 - 40 = 26.25), roughly PKR 157,000 per week. That is the sentence a manager needs, not "F1 improved from 0.41 to 0.52". Evaluation is where metrics turn into a decision, and where you choose between going back to stage 2 for better features or moving on to deployment.
A skeleton you can reuse
# run locally: the shape of a CRISP-DM project in one script
import pandas as pd
from sklearn.model_selection import train_test_split
from sklearn.linear_model import LogisticRegression
from sklearn.metrics import precision_score

df = pd.read_csv("customers.csv")                 # 2. data understanding
df = df.dropna(subset=["tenure_months"])           # 3. preparation (simplified)
X = df[["tenure_months", "orders_90d", "complaints"]]
y = df["churned"]
X_tr, X_te, y_tr, y_te = train_test_split(X, y, test_size=0.2, random_state=42)

model = LogisticRegression(max_iter=1000).fit(X_tr, y_tr)   # 4. modelling
scores = model.predict_proba(X_te)[:, 1]
top500 = scores.argsort()[::-1][:500]                        # 5. evaluation
print("precision of top 500:", y_te.iloc[top500].mean())
What stage 1 uncovered at a Karachi bank: The fraud team asked for "a model". In stage 1 the analyst found the real bottleneck. Investigators could review 300 alerts a day and the existing rules produced 1,100. So the goal was rewritten from "detect fraud" to "rank alerts so the 300 we review contain the most fraud". Stage 2 then showed that the "confirmed fraud" label lagged by 45 days, so training data had to stop 45 days before the cut-off. Those two findings shaped everything that followed, and neither one involved an algorithm.
Before you move on
CRISP-DM is a loop, not a line: business, data, preparation, modelling, evaluation, deployment, then round again. Write down the decision, the metric, the baseline and the constraints before you open a single table. Budget half the effort for data work. Always compare against a simple baseline on unseen data, and translate the result into business units so a non-technical owner can decide. If your SQL is shaky, the data-understanding stage is where it shows, and our SQL track is the fastest fix.
Three things to try
- Write a stage-1 brief (decision, metric, baseline, constraints) for a Rawalpindi private school that wants to predict which students need extra tutoring before board exams.
- Using the evaluation table, compute the rupee gain per week of logistic regression over the rule, with the same assumptions.
- List three data-understanding checks you would run on a billing table before modelling (for example, "are there negative amounts?").
Lesson 3 of 18
Sign in to track your progress and earn XP for every lesson you finish.