
☰ Learn Machine Learning Tutorial Menu
Data Preparation: Cleaning, Encoding, Scaling
Written by Faisal Adnan · Updated 26 Sept 2026 · 5 min read
Here's a ratio that hasn't changed in any project we've done: two days on the algorithm, three weeks on the export from the client's billing system. Algorithms are picky eaters. They want a tidy rectangle of numbers with no gaps, one meaning per column, and columns on comparable scales. A raw CRM dump is nothing like that. Data preparation is the set of repeatable steps that gets you from one to the other, and it splits into three jobs, cleaning, encoding categories and scaling numbers.
Cleaning: make every value trustworthy
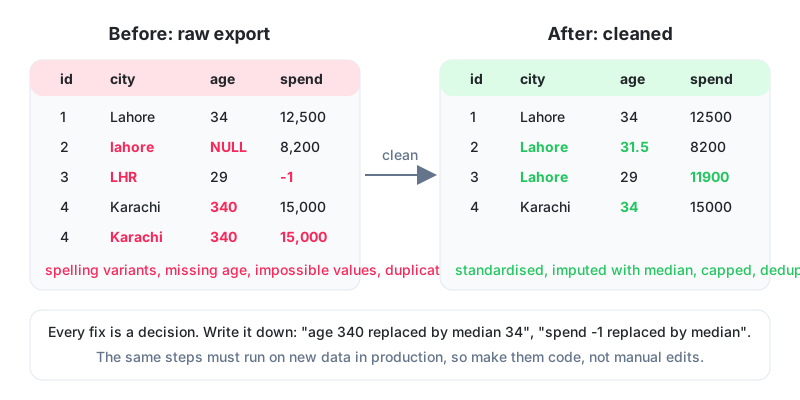
| Problem | How to spot it | Common fix |
|---|---|---|
| Missing values | count of NULL per column | numeric: median; category: "unknown"; or drop the column if mostly empty |
| Inconsistent categories | value counts show "Lahore", "lahore", "LHR" | lower-case, trim, map aliases to one spelling |
| Impossible values | min/max: age 340, price -1 | treat as missing, or cap at a sensible limit |
| Duplicates | same id or same (customer, timestamp) twice | keep one, ideally the latest |
| Wrong types | amount stored as text "12,500" | strip separators, convert to number |
| Outliers | a few rows far from the rest | investigate first; cap (winsorise) or keep if genuine |
Whatever you do, don't fix values by hand in Excel. Write every fix as code so it runs identically on next month's export and in production. The student who "just quickly" corrected 40 city names by hand is the same student who can't reproduce the model a month later.
Encoding: turning text into numbers
Models do arithmetic, so "Lahore" must become numbers. Two rules:
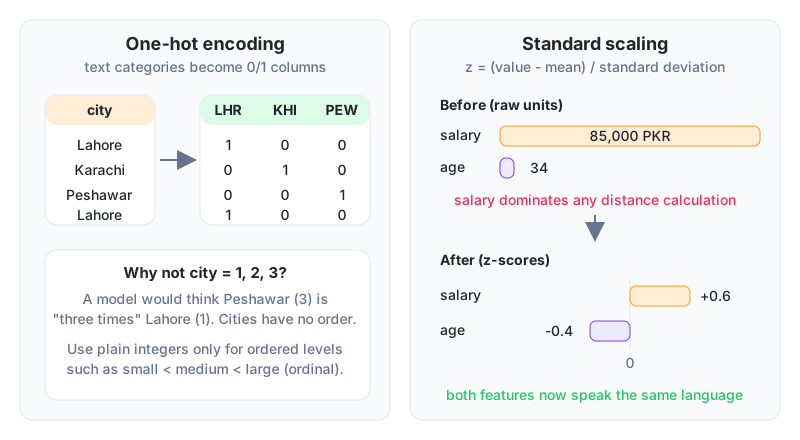
- Nominal categories (city, product type) have no order. Use one-hot encoding: one 0/1 column per value.
- Ordinal categories (small < medium < large; grade C < B < A) have an order. Map them to integers that preserve it.
Giving nominal categories plain integers (Lahore = 1, Karachi = 2, Peshawar = 3) is a classic bug we see in almost every batch. A linear model will believe Peshawar is "more" than Lahore. Tree models tolerate it better but still learn odd splits.
Scaling: putting columns on the same ruler
Distance-based and gradient-based models (kNN, SVM, logistic regression, neural networks) get pushed around by whichever column has the biggest numbers. Salary in rupees (tens of thousands) drowns age (tens). Scaling fixes that. Tree-based models don't care either way.
| Method | Formula | Result | Use when |
|---|---|---|---|
| Standardisation (z-score) | (x - mean) / std | mean 0, std 1 | default for linear models, SVM, PCA |
| Min-max | (x - min) / (max - min) | range 0 to 1 | when a bounded range is needed, e.g. neural nets |
| Log transform | log(1 + x) | compresses long tails | money, counts with a few huge values |
Standardise five applicants by hand
Five loan applicants, two features. We use the population standard deviation (divide by n), which is what scikit-learn's StandardScaler does.
Salary: mean = (40 + 55 + 65 + 75 + 90) / 5 = 65 thousand. Deviations: -25, -10, 0, 10, 25. Squares: 625, 100, 0, 100, 625, sum 1,450, divided by 5 = 290, square root = 17.03.
Age: mean = (25 + 30 + 33 + 38 + 40) / 5 = 33.2. Deviations: -8.2, -3.2, -0.2, 4.8, 6.8. Squares: 67.24, 10.24, 0.04, 23.04, 46.24, sum 146.8, divided by 5 = 29.36, square root = 5.42.
| Applicant | Salary (PKR) | Age | z(salary) = (x - 65,000) / 17,030 | z(age) = (x - 33.2) / 5.42 |
|---|---|---|---|---|
| 1 | 40,000 | 25 | -1.47 | -1.51 |
| 2 | 55,000 | 30 | -0.59 | -0.59 |
| 3 | 65,000 | 33 | 0.00 | -0.04 |
| 4 | 75,000 | 38 | 0.59 | 0.89 |
| 5 | 90,000 | 40 | 1.47 | 1.25 |
Before scaling, applicants 1 and 5 were 50,000 apart in salary and 15 apart in age, so any distance calculation would be almost entirely salary. After scaling the gaps are 2.94 and 2.76. Both features now count roughly equally.
Fit on train, apply to test
The mean and std used for scaling, and the median used for imputation, must come from the training rows only and then be applied to test and production rows. Compute them on all the data and you've leaked test information into training. scikit-learn's Pipeline enforces this for you, which is why we insist on it from the first assignment.
# run locally
from sklearn.compose import ColumnTransformer
from sklearn.pipeline import Pipeline
from sklearn.preprocessing import OneHotEncoder, StandardScaler
from sklearn.impute import SimpleImputer
from sklearn.linear_model import LogisticRegression

num = ["salary", "age"]
cat = ["city"]
prep = ColumnTransformer([
    ("num", Pipeline([("impute", SimpleImputer(strategy="median")),
                      ("scale", StandardScaler())]), num),
    ("cat", OneHotEncoder(handle_unknown="ignore"), cat),
])
model = Pipeline([("prep", prep), ("clf", LogisticRegression(max_iter=1000))])
# model.fit(X_train, y_train); model.predict(X_new)
# scaling statistics come from X_train only
The zero-units trap at a Karachi utility: A utility analytics team we know built a model to flag meters likely to be tampered with. The raw billing export had "units consumed" stored as text with commas, three spellings of each area name, and 4% of rows with zero units because of estimated bills. The first model looked great. Then they realised the estimated-bill rows were all labelled "not tampered" simply because nobody had inspected them, so the model had learned "zero units = safe", the opposite of the truth. Flagging estimated bills as a separate feature and dropping uninspected rows from training mattered far more than the choice of algorithm.
Quick recap
- Handle missing, inconsistent, impossible and duplicate values in code, never by hand.
- One-hot encode nominal categories; integer-encode only the ordered ones.
- Scale numeric features for distance- and gradient-based models; trees don't need it.
- Imputation and scaling statistics come from training data only. Use a Pipeline.
- Every cleaning decision is an assumption, so write it down where the next analyst will find it.
Try this
- A column "payment_method" has values Cash, Card, JazzCash, EasyPaisa. Write the one-hot encoded rows for a Card payment and a JazzCash payment.
- Compute the min-max scaled value of a salary of 75,000 when the training minimum is 40,000 and maximum is 90,000.
- Explain in two sentences why replacing missing ages with the median of the whole dataset (test set included) is a leak, even if it feels harmless. If pandas is new to you, our Python track covers the basics you need here.
Lesson 4 of 18
Sign in to track your progress and earn XP for every lesson you finish.