
☰ Learn Python Tutorial Menu
Data Analysis with Pure Python (statistics, collections)
Written by Faisal Adnan · Updated 26 Sept 2026 · 4 min read
Every batch, someone tries to pip install pandas to average 200 rows. Don't. For a few thousand rows, statistics, collections and a couple of built-ins answer most business questions. Totals, averages, medians, top-N, group-by, distribution. And learning them first is what makes pandas click later, because pandas does these same operations on bigger data with shorter names. Everything on this page runs in the playground.
Sample data
We'll work with a small list of dicts, the shape csv.DictReader or a JSON API hands you.
sales = [
    {"city": "Lahore",  "product": "Shoes", "amount": 2500, "qty": 1},
    {"city": "Multan",  "product": "Bag",   "amount": 1800, "qty": 2},
    {"city": "Lahore",  "product": "Shoes", "amount": 3200, "qty": 1},
    {"city": "Karachi", "product": "Watch", "amount": 9100, "qty": 1},
    {"city": "Lahore",  "product": "Bag",   "amount": 1500, "qty": 3},
    {"city": "Karachi", "product": "Shoes", "amount": 2700, "qty": 1},
    {"city": "Multan",  "product": "Watch", "amount": 8400, "qty": 1},
]
amounts = [s["amount"] for s in sales]
Descriptive statistics
import statistics as st

print("count  ", len(amounts))
print("total  ", sum(amounts))
print("mean   ", round(st.mean(amounts), 2))
print("median ", st.median(amounts))
print("mode   ", st.mode([s["product"] for s in sales]))
print("stdev  ", round(st.stdev(amounts), 2))
print("min/max", min(amounts), max(amounts))
print("quartiles", st.quantiles(amounts, n=4))
The mean is dragged up by the two watches. The median (middle value) is a better "typical sale" whenever a few large values distort the average, which in sales data is nearly always. When a client asks for "the average order", we usually show them both and explain the gap. stdev measures spread, quantiles(n=4) gives the three cut points that split the data into quarters, and mode works on text too, returning the most common value.
Counting with Counter
from collections import Counter

by_product = Counter(s["product"] for s in sales)
print(by_product)                          # Counter({'Shoes': 3, 'Bag': 2, 'Watch': 2})
print(by_product.most_common(1))           # [('Shoes', 3)]
print(by_product["Laptop"])                # 0, no KeyError

units = Counter()
for s in sales:
    units[s["product"]] += s["qty"]        # count with weights
print(units.most_common())
Counter is a dict subclass built for counting. It replaces the manual counts.get(k, 0) + 1 loop from Lesson 10 and adds most_common(). Two Counters add together with +, which is a neat way to roll daily counts into monthly ones.
Group-by with defaultdict
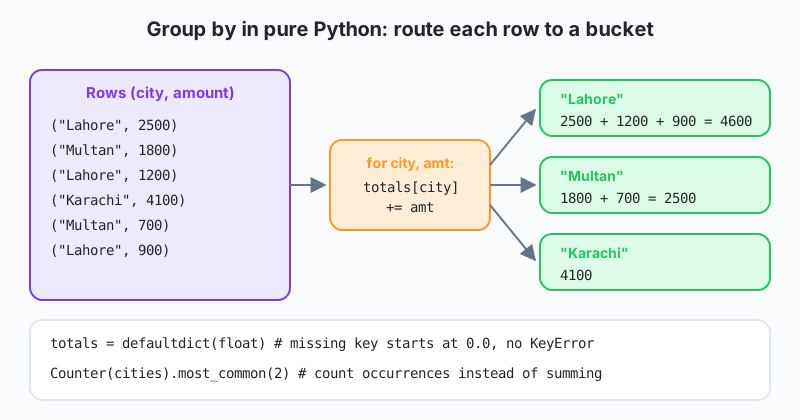
from collections import defaultdict

total_by_city = defaultdict(float)
rows_by_city = defaultdict(list)
for s in sales:
    total_by_city[s["city"]] += s["amount"]
    rows_by_city[s["city"]].append(s["amount"])

for city in sorted(total_by_city, key=total_by_city.get, reverse=True):
    vals = rows_by_city[city]
    print(f"{city:<8} n={len(vals)}  total={total_by_city[city]:>8,.0f}  avg={st.mean(vals):>8,.0f}")
defaultdict(float) creates a 0.0 the first time a missing key is touched, and defaultdict(list) creates an empty list. The if key not in d check disappears. Grouping by two things is just a tuple key, as in totals[(s["city"], s["product"])] += s["amount"].
Top-N and sorting records
top3 = sorted(sales, key=lambda s: s["amount"], reverse=True)[:3]
for s in top3:
    print(s["city"], s["product"], s["amount"])

import heapq
print(heapq.nlargest(2, amounts))          # [9100, 8400]  efficient for big lists
Percentages and shares
grand_total = sum(total_by_city.values())
for city, total in total_by_city.items():
    print(f"{city:<8} {total / grand_total:.1%}")

# month-over-month style comparison
last = {"Lahore": 6500, "Multan": 11000, "Karachi": 9800}
for city, total in total_by_city.items():
    change = (total - last[city]) / last[city]
    print(f"{city:<8} {change:+.1%}")        # + sign shown for growth
A quick histogram
bins = Counter()
for a in amounts:
    bucket = (a // 2000) * 2000                # 0, 2000, 4000, ...
    bins[bucket] += 1
for lo in sorted(bins):
    print(f"{lo:>5}-{lo + 1999:<5} {'#' * bins[lo]}")
Floor division into buckets is the fastest way to see the shape of your data in a terminal before you draw a proper chart (Lesson 24). I do this on every new dataset before anything else.
Worked example, a complete mini report
import statistics as st
from collections import Counter, defaultdict

def analyse(rows):
    amounts = [r["amount"] for r in rows]
    by_city = defaultdict(list)
    for r in rows:
        by_city[r["city"]].append(r["amount"])
    return {
        "orders": len(rows),
        "revenue": sum(amounts),
        "median_order": st.median(amounts),
        "top_product": Counter(r["product"] for r in rows).most_common(1)[0][0],
        "best_city": max(by_city, key=lambda c: sum(by_city[c])),
        "city_avg": {c: round(st.mean(v)) for c, v in by_city.items()},
    }

for key, value in analyse(sales).items():
    print(f"{key:<13} {value}")
Exam results on an office PC in Rawalpindi: A school's exam office has about 1,400 result rows in a CSV and no permission to install software. With
statisticsandCounter, a 40-line script produces class averages and medians, the grade distribution per subject, the top ten students, and the number of students who failed exactly one subject (aCounterover student names in failing rows, filtered to a value of 1). No installs, and it finishes in under a second.
What to carry into pandas
statisticsgives mean, median, mode, stdev and quantiles. Prefer the median when outliers exist.Countercounts anything and offersmost_common().defaultdict(float)anddefaultdict(list)make group-by loops clean.sorted(..., key=lambda ...)andheapq.nlargesthandle top-N.- These are exactly what pandas
groupby,value_countsanddescribedo at scale.
Exercises
- Using the
salesdata, compute revenue per product and the share of each product as a percentage of total revenue. - Add a
"day"key to each row (any three distinct dates) and produce the daily revenue and daily order count in one pass with twodefaultdicts. - Write
outliers(values)that returns the values more than two standard deviations from the mean, and test it on a list where one value is very large.
Lesson 21 of 26
Sign in to track your progress and earn XP for every lesson you finish.
Practice tip: the built-in code runner is being upgraded. Until it is back, copy the examples into any SQL or Python tool you have (for example SQLite, PostgreSQL, MySQL, SQL Server or a free online editor) and run them there. You can keep reading and earning XP here.