
☰ Learn Python Tutorial Menu
Introduction to NumPy
Written by Faisal Adnan · Updated 26 Sept 2026 · 5 min read
An actuarial analyst at a Karachi insurer needed to simulate 100,000 claim outcomes for a motor portfolio. Her loop took eleven minutes per run, and the pricing meeting needed twenty runs. The fix was NumPy. NumPy (Numerical Python) is the foundation under pandas, matplotlib, scikit-learn and nearly every scientific Python library. Its core idea is the array, a grid of numbers of one type, stored compactly, where operations run in fast compiled code instead of Python loops. You'll rarely write raw NumPy in daily analysis, but knowing it explains why pandas behaves the way it does and lets you read any data science codebase. It's not in the standard library, so run these locally after pip install numpy.
Arrays versus lists
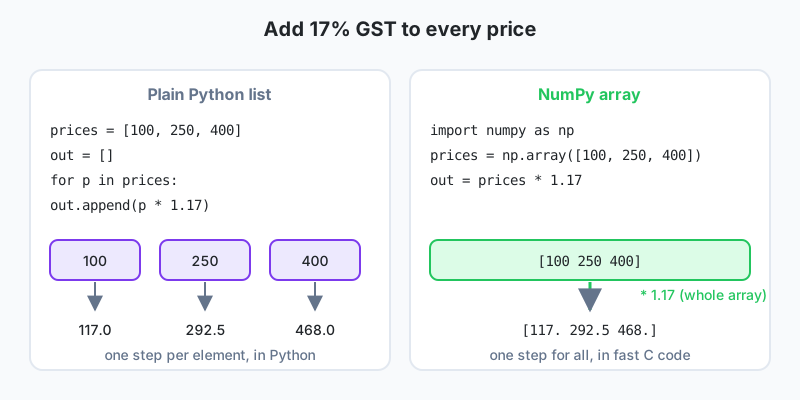
import numpy as np

prices = np.array([100, 250, 400, 1200])
print(prices * 1.17)               # [ 117.   292.5  468.  1404. ]  whole array at once
print(prices.dtype, prices.shape)  # int64 (4,)

py_list = [100, 250, 400, 1200]
print(py_list * 2)                 # list repetition, NOT arithmetic: [100, 250, ..., 100, 250, ...]
Multiply a list by a number and it repeats. Multiply an array by a number and each element is multiplied. This element-wise behaviour is vectorisation, and it's both shorter and often tens of times faster than a loop, because the loop happens inside NumPy's C code.
All elements of an array share one dtype (int64, float64, bool and so on). Mix an int and a float and the whole array becomes float. That uniformity is what makes arrays compact and fast.
Creating arrays
print(np.zeros(4))                 # [0. 0. 0. 0.]
print(np.ones((2, 3)))             # 2 rows, 3 columns of 1.0
print(np.arange(0, 10, 2))         # [0 2 4 6 8]   like range()
print(np.linspace(0, 1, 5))        # [0.   0.25 0.5  0.75 1.  ]  evenly spaced
rng = np.random.default_rng(42)
print(rng.integers(1000, 9000, size=5))   # random order amounts, reproducible
Indexing, slicing and masks
a = np.array([2500, 1800, 3200, 9100, 1500, 2700])
print(a[0], a[-1], a[1:4])         # like lists
print(a[a > 2000])                 # [2500 3200 9100 2700]   boolean mask
print((a > 2000).sum())            # 4   True counts as 1
a[a < 2000] = 2000                 # floor every value at 2000, in place
print(a)
The mask a > 2000 is itself an array of True and False. Use it as an index and only the True positions survive. This is exactly how pandas filtering works underneath, which is why the bracket rules in Lesson 22 look the way they do.
Aggregations
a = np.array([2500, 1800, 3200, 9100, 1500, 2700])
print(a.sum(), a.mean(), a.min(), a.max())
print(np.median(a), a.std().round(2))
print(np.percentile(a, [25, 50, 75]))
print(a.argmax())                  # index of the largest value: 3
print(np.cumsum(a))                # running total
Two-dimensional arrays
monthly = np.array([
    [120, 95, 140],     # Lahore: Jan Feb Mar
    [80, 110, 130],     # Multan
    [200, 180, 210],    # Karachi
])
print(monthly.shape)               # (3, 3)
print(monthly[2, 0])               # 200   row 2, column 0
print(monthly[:, 1])               # [ 95 110 180]  February for every city
print(monthly.sum(axis=0))         # [400 385 480]  per month (down the columns)
print(monthly.sum(axis=1))         # [355 320 590]  per city  (across the rows)
print(monthly.mean(axis=1).round(1))
axis=0 collapses rows (one result per column) and axis=1 collapses columns (one result per row). This is the most confusing bit of NumPy for beginners, and pandas uses the same convention, so it's worth a mnemonic. Axis is the dimension that disappears. Say it twice.
Broadcasting
targets = np.array([150, 100, 220])              # one per city
shortfall = targets[:, None] - monthly           # (3,1) minus (3,3): NumPy stretches the column
print(shortfall)
print(monthly / monthly.sum(axis=1, keepdims=True))   # each city's monthly share of its own total
Broadcasting is NumPy's rule for combining arrays of different shapes. The smaller array is stretched along the missing dimension without copying. It's powerful and occasionally surprising. When a result has a shape you didn't expect, print .shape of each operand before you do anything else.
Useful functions
a = np.array([2500, 1800, 3200, 9100, 1500, 2700])
print(np.where(a > 3000, "large", "normal"))     # vectorised if/else
print(np.round(a * 1.17, 2))
print(np.sort(a)[::-1][:3])                      # top three
print(np.unique(np.array(["Lahore", "Multan", "Lahore"]), return_counts=True))
print(np.isnan(np.array([1.0, np.nan, 3.0])))    # missing values are nan in float arrays
print(np.nanmean(np.array([1.0, np.nan, 3.0])))  # 2.0, ignores nan
Where NumPy shows up in your work
- Every pandas column is a NumPy array underneath (
df["amount"].to_numpy()). - matplotlib takes arrays for x and y values.
- Machine learning libraries expect features as a 2-D array of shape (rows, columns).
- Simulations and financial models (loan schedules, Monte Carlo) run orders of magnitude faster on arrays.
How the eleven-minute loop became one second: Instead of looping, she generated all 100,000 samples at once with
rng.normal(mean, sd, size=100000), applied the excess withnp.maximum(claims - 10000, 0), and summed. Under a second per run, so twenty pricing scenarios fit inside one meeting instead of spreading across a week.
Hold on to these
- An array holds one dtype and supports element-wise arithmetic (vectorisation) without loops.
- Boolean masks select and modify elements, as in
a[a > x]. - Aggregations take an
axis. 0 works down columns, 1 across rows. - Broadcasting stretches smaller arrays to match. Check
.shapewhen results look odd. - pandas and matplotlib are built on NumPy arrays, so these ideas carry over directly.
Try these locally
- Create an array of 12 monthly sales figures, compute the running total with
cumsum, and find the first month where it exceeds a target usingargmaxon a mask. - Build a 4-by-3 array of marks (students by subjects) and print each student's average and each subject's highest mark using
axis. - Generate 10,000 random daily returns with
rng.normal(0.0005, 0.02, 10000)and compute the percentage of days with a loss greater than 3%.
Lesson 23 of 26
Sign in to track your progress and earn XP for every lesson you finish.
Practice tip: the built-in code runner is being upgraded. Until it is back, copy the examples into any SQL or Python tool you have (for example SQLite, PostgreSQL, MySQL, SQL Server or a free online editor) and run them there. You can keep reading and earning XP here.